Advanced Urban Bicycle Accident Dashboard
Problem to Solve
Bicycle usage is increasing in cities, but urban infrastructure is not always ready to support it safely. Understanding when, where, and why these accidents happen is essential to improving public safety and urban mobility.
- Lack of clarity in the most frequent types of bicycle accidents and their root causes.
- Need to identify high-risk districts and demographics to focus public policy efforts.
- Demand for a centralized visual tool that communicates safety risks to both citizens and city planners.
- Traditional reports lack interactivity and make it harder to detect key behavioral patterns in real time.
Proposed Solution
I developed a dynamic dashboard with Power BI, enriched with interactive charts, KPIs, and visual storytelling techniques. The dashboard consolidates accident data from 2024 to help users explore critical safety trends by accident type, location, and demographic factors.
- Data cleaning and modeling to standardize key fields like gender, district, and accident type.
- Custom KPIs created to highlight total incidents, gender distribution, and district rankings.
- Interactive filters enable on-the-fly data exploration for different periods, types of accident or zones.
- Story-focused design that aligns visual hierarchy and data flow for better comprehension.
- Integrated geospatial breakdown to reveal high-risk zones for targeted intervention.
- Responsive layout optimized for use by city planners, analysts, and policy designers.
Results
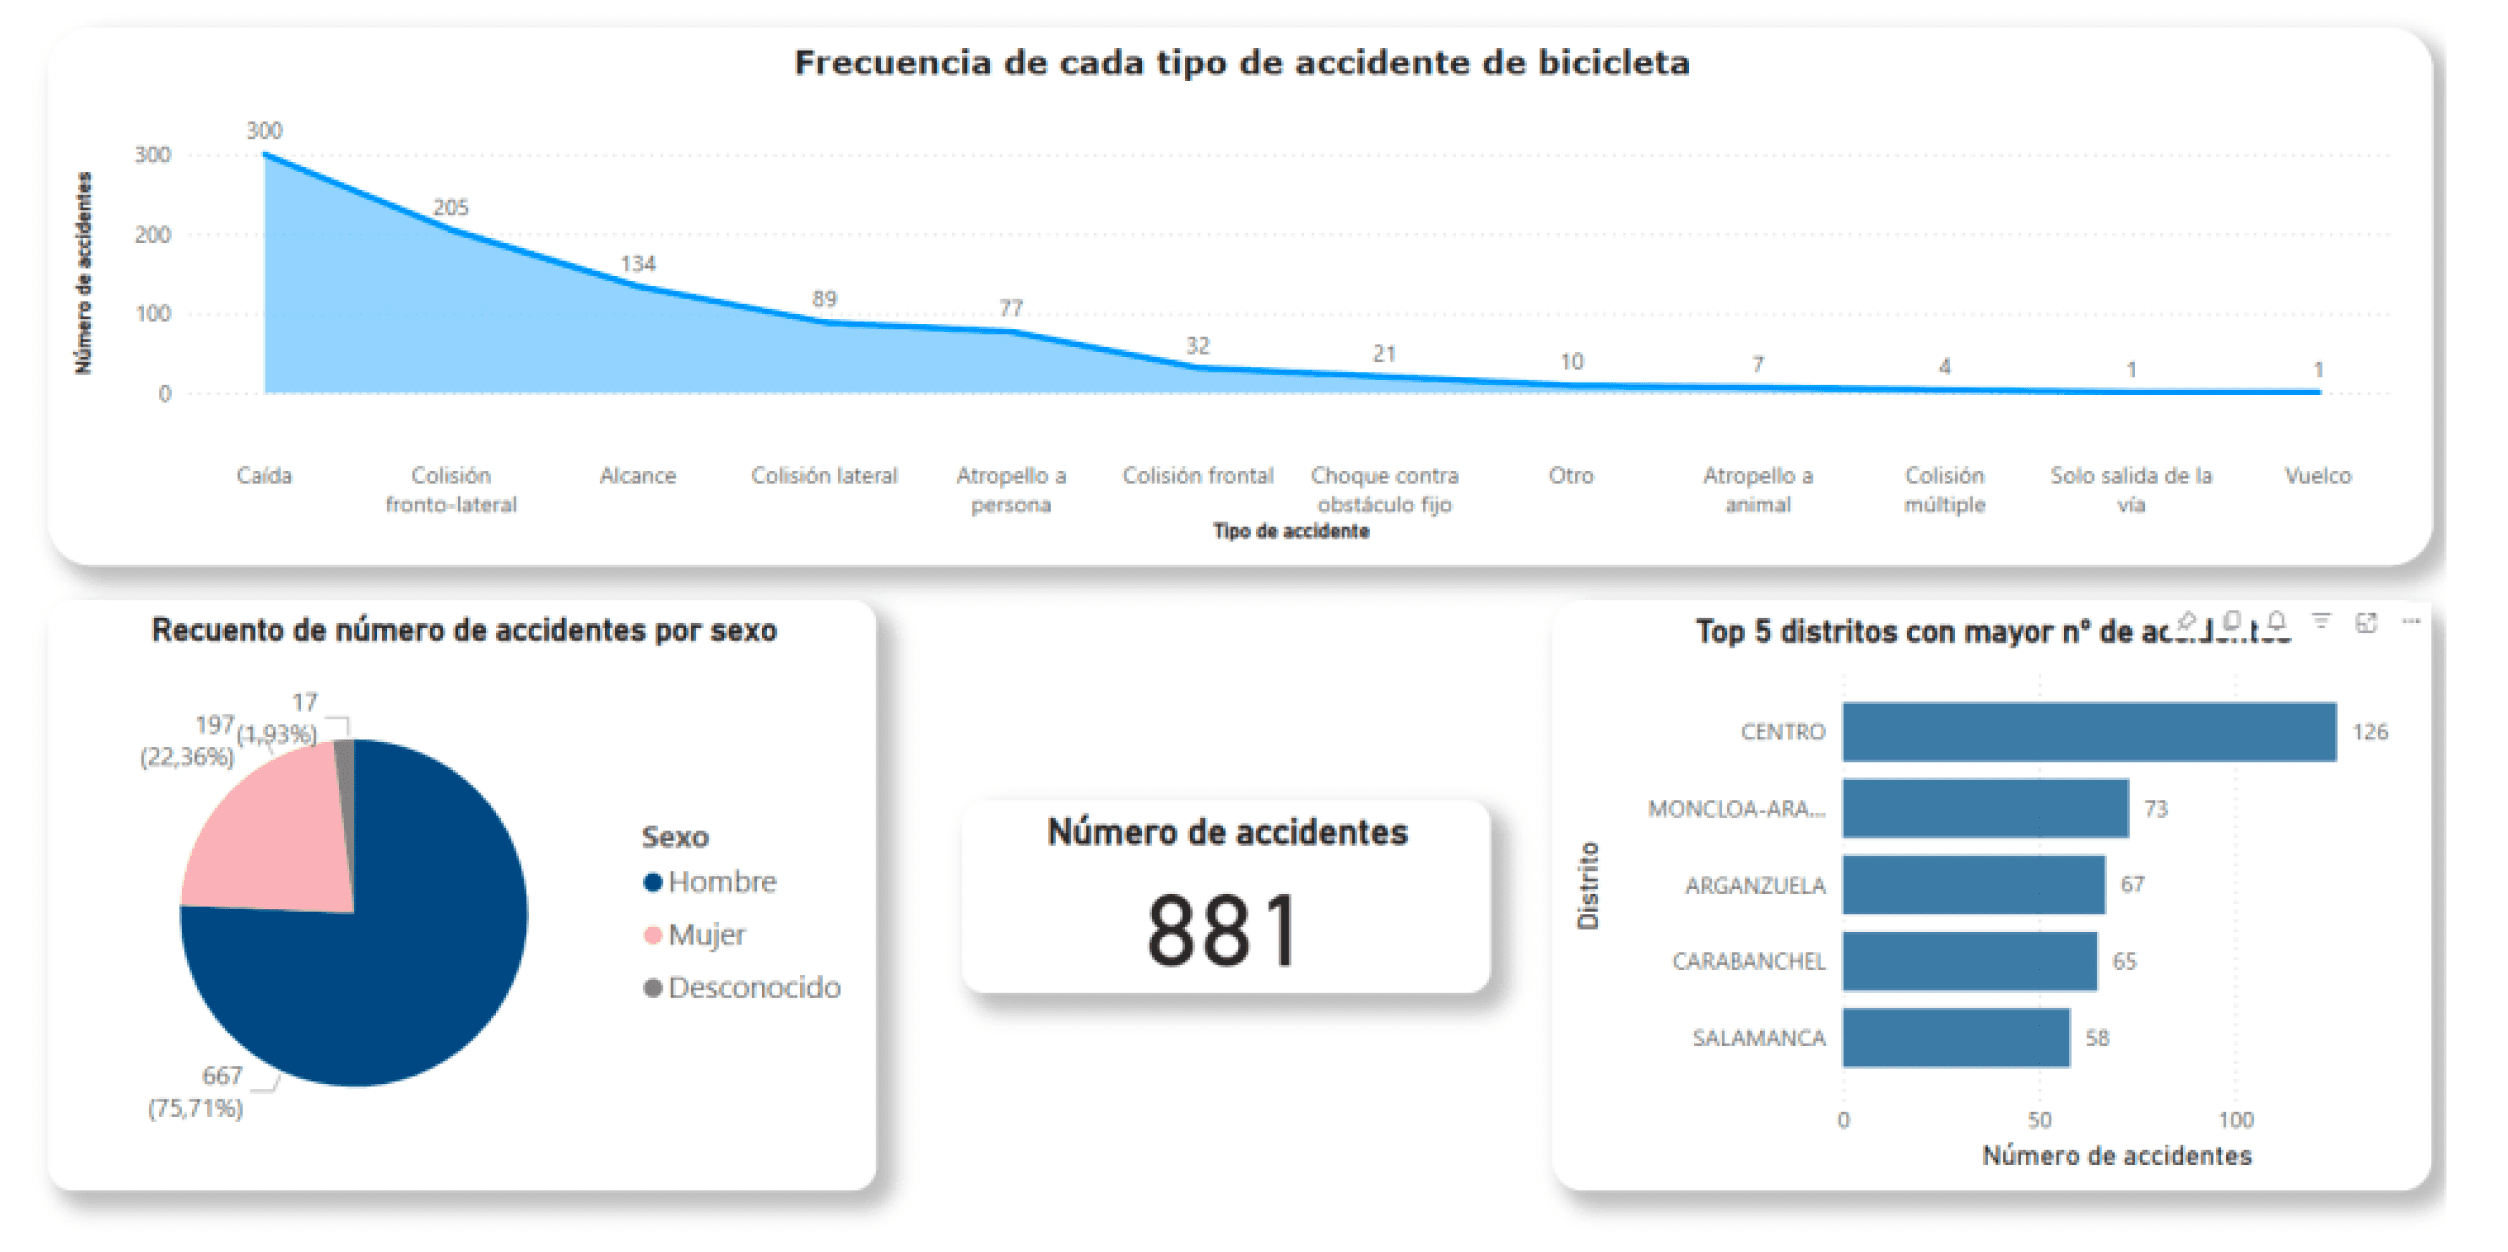
The dashboard successfully uncovered deep insights into urban bicycle accident patterns, revealing key clusters of risk, gender disparity in accidents, and the dominance of certain districts in incident counts. Its clarity and interactivity make it a powerful tool for both policy and education.
- TOP ACCIDENT TYPES: Falls and fronto-lateral collisions are the most frequent, revealing issues with road design and signaling.
- DISTRICT HOTSPOTS: Centro, Moncloa y Arganzuela emerge as the top three zones requiring intervention.
- GENDER INSIGHTS: Over 75% of accidents involve men, prompting reflection on cycling behavior and safety awareness.
- KPI PANEL: Dynamic total of 881 recorded incidents with real-time filtering, enhancing usability and responsiveness.
- DECISION-MAKING READY: The dashboard provides immediate visual feedback to explore 'what-if' scenarios for safer city planning.